
by Dr. Alka Tripathy-Lang
When it comes to managing water resources around the world, the water we see—rivers and lakes—garner the most attention. However, storage in the form of underground water reservoirs, or aquifers, is equally important, but attracts far less consideration than surface water resources. The U.S. Geological Survey (USGS) runs a national network of groundwater monitoring wells, but not all countries have this capability. In particular, regions under severe water stress like the Sahel region of Africa, India and Pakistan have sparse groundwater monitoring networks. In such places, finding alternative ways to track groundwater levels is critical as society responds to global challenges like climate change and food security.
 In a paper recently published in Geophysical Research Letters, Doyeon Kim and Vedran Lekic at the University of Maryland explore how seismic data could be used to monitor groundwater levels. In this proof-of-concept study focused on the Gulf Coast Aquifer System of Southern Texas, they found that a single seismometer can track yearly changes in groundwater level, which may be helpful for aquifers around the world that lack monitoring wells. Many of the above-mentioned regions host Global Seismographic Network stations, suggesting this approach may be useful in managing limited water resources.
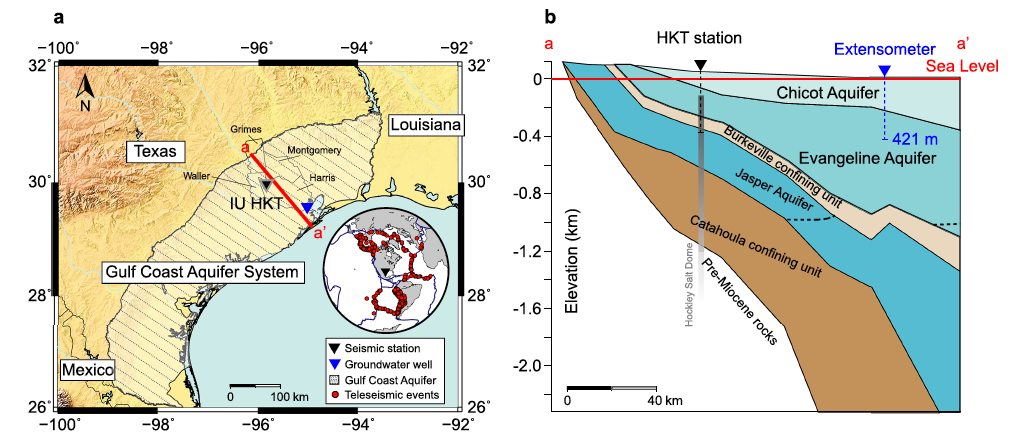
Kim focused on 23 years of data from a single seismic station, IU.HKT, located near Houston, Texas (Figure 1). All data are available from IRIS.
The station is installed above the Gulf Coast Aquifer System, which allowed Kim and Lekic to examine different types of vibrations to “see” what’s happening in the subsurface. These vibrations can have a variety of sources. Kim and Lekic focus on two in particular—teleseismic earthquakes and ambient seismic noise.
When an earthquake ruptures, its seismic waves propagate through the subsurface. Seismic stations located near the epicenter record waves that did not travel as far, or dive as deep into the Earth, as stations that are located hundreds, or even thousands of kilometers away. If a seismometer is more than 1000 kilometers from an earthquake’s epicenter, the event is considered “teleseismic.”
Teleseismic recordings can be processed to eliminate information about the earthquake source, leaving only signals from Earth’s internal structural information beneath the seismic station, says Kim. The particular processing method employed by Kim and Lekic can constrain shallow structures at scales of less than 500 meters, which allows them to infer ground water levels. They used 829 teleseismic earthquakes greater than magnitude-5.5, which repeatedly illuminated the same volume of the aquifer system semi-continuously (Figure 2).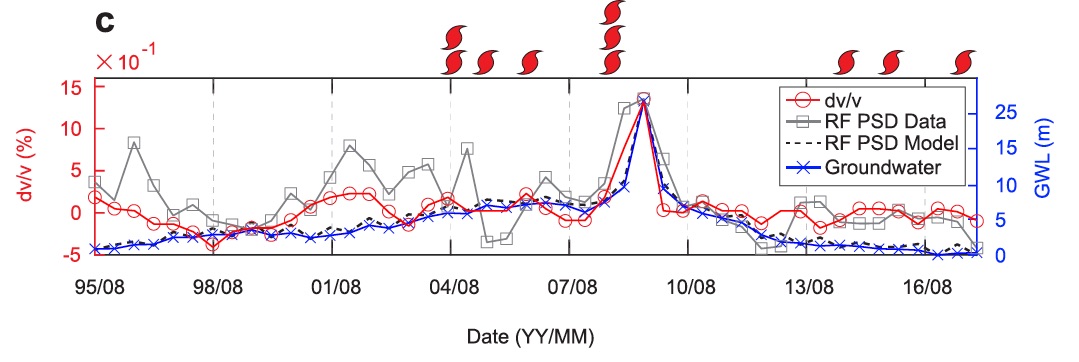
Seismometers also record another type of vibration called ambient seismic noise. These vibrations, called microseisms, are produced primarily when ocean waves pound the coastlines and vibrate the seafloor, according to Kim. Seismic stations measure this noise worldwide, all the time, which is ideal for continuous monitoring.
To utilize these data, Kim says they deduced changes in subsurface velocity relative to a reference state, which is a 23-year average in this case, with the idea that velocity changes might serve as a groundwater level proxy (Figure 2).
A nearby USGS monitoring well in the aquifer provides true groundwater levels, to which Kim and Lekic compared their subsurface velocity information from both methods.
A surge of groundwater level followed three consecutive 2008 hurricanes that affected Texas—Gustav, Ike and Norbert. The surge accompanied changes in vibrations from both teleseismic earthquakes and ambient noise (Figure 2). Kim notes, “Our result does not show a strong correlation with daily precipitation.” Instead, they find that single-station seismic data seems to correspond to groundwater level changes at the yearly scale.
Figure 1. (a) Map of study area showing extent of Gulf Coast Aquifer System, location of seismic station IU.HKT, and USGS groundwater monitoring well. Inset shows teleseismic earthquakes, red circles, used in this study. (b) Cross section across the Gulf Coast Aquifer, which is located on the red line labeled a-a’ in (a). The seismic station, IU.HKT (black upside-down triangle), is located in the Hockley Salt Dome, and the USGS monitoring well (upside-down blue triangle) is located in the Evangeline Aquifer. From Kim and Lekic (2019).
Figure 2. Groundwater data spanning 1995 to 2017, shown in blue, match reasonably well, especially in 2008, with the red line, which is velocity information derived from ambient seismic noise, and the gray line, which is velocity information derived from teleseismic data. The red sigmoidal shapes correspond to hurricanes affecting Texas. Notice that three hurricanes precede a surge in groundwater levels in 2008. Figure from Kim and Lekic (2019).
Citation
Kim, D. & Lekic, V. (2019). Groundwater cations from autocorrelation and receiver functions. Geophysical Research Letters, 46, 13722-13729. https://doi.org/10.1029/2019GL084719
