
by Dr. Alka Tripathy-Lang and Dr. Wendy Bohon
You may not have heard of Virginia City, Nevada, but the small mining town, whose motto is “Step Back in Time,” boasts nuggets of history familiar to most. In 1859, the town sprang to life with the discovery of the Comstock Lode—the first major silver ore discovery in the U.S. In the 1860s, a reporter working in Virginia City named Samuel Clemens coined his now famous alias—Mark Twain.
 Virginia City’s story as once-booming hub for both silver and gold mining lends itself to throwback tourism, where much of the city’s economy rests, rather literally, on old mines. Below the city, tunnels and shafts spider through the earth, significantly increasing the risk of ground failure in the event of an earthquake. The unreinforced masonry structures built above this maze are vulernable to strong shaking. In the event of emergency, the single lane roads winding through the surrounding mountainous terrane—the only way in and out of Virginia City,—would hamper relief efforts if a landslide blocked this lifeline.
In January of 2014, a small seismic swarm, a series of earthquakes clustered in time and space with no clear mainshock, rattled Virginia City for approximately 10 days (Figure 1). The local population felt four events greater than magnitude-3.0. In all, seismic networks picked up 351 events. To understand what happened, Rachel Hatch, a doctoral student at the University of Nevada Reno at the time of this study, examined a trove of data from the Nevada Seismological Laboratory regional seismic network, which is freely available from the IRIS Data Management Center. She and her coauthors’ careful analysis, published in the February 2020 issue of Geophysical Research Letters traces the migration of these events along three distinct planes in the subsurface. The cause of seismic swarms remains enigmatic, but Hatch and her colleagues’ work suggests that in this case, the swarm may include two mechanisms. The first mechanism, called pore fluid diffusion, results from the movement of warm fluids in the interstitial spaces between the individual minerals that make up the rocks. The second, called aseismic slip, occurs when both sides of a fault creep past each another without producing any earthquakes until they get stuck and break, producing seismicity.
To extract detailed information from the relatively small quakes that popped off below the surface of Virginia City, Hatch and her colleagues had to relocate each event. To understand relocation, Hatch says, we must start with the basics; how and why do scientists rapidly locate events to begin with?
When an earthquake ruptures below the surface, no one knows until its seismic waves, specifically its P-wave and S-wave, travel to the surface. Even then, unless the rupture occurs directly under a seismometer, these waves must propagate to the nearest seismic station for scientists to know anything has happened. To triangulate where the epicenter of the earthquake lies, scientists need the waves travel to at least three stations. Only then can powerful computers calculate everything else needed to send out warnings to the local or regional populace, if such an earthquake early warning system is in place. Although this process sounds arduous, in fact, it takes mere seconds from when the fault ruptures, especially in places with dense instrumentation, like the west coast of the U.S.
For small earthquakes that do not pose as much of a hazard, sensitive seismic stations still pipe that information in real time to scientists whose computers rapidly assess location. These initial locations, Hatch says, are good enough for communicating hazards.
However, for mining every ounce of information from clouds of earthquakes like the Virginia City swarm, scientists must carefully check each quake via a process called relocation. “Initial measurements [of earthquake locations often] contain errors,” says Hatch. These subtle inaccuracies stem from incorrectly selecting the first arrivals of seismic waves at a particular station, or using an inaccurate model of what the earth looks like between the earthquake and the seismic stations, she explains.
 To relocate as many events as possible, Hatch and her coauthors began by correcting each quake for details like local subsurface geology (also called the local velocity model), local relief, and any differences between seismic stations. Then, she compared each event with every other event. If certain aspects of two events correlate, she says, “[it] means the more likely these two events are relatively close in space.” In total, she and her coauthors successfully relocated 305 hypocenters that occurred during the 10-day study period, and the diffuse puff of earthquakes resolved into three separate planar structures that had never been imaged before (Figure 2).
Quakes along the first plane migrated upward for eight days at rates consistent with a process called pore fluid diffusion. Hatch inferred warm, naturally occurring geothermal fluids could be rising into minuscule pore spaces between individual mineral crystals, occasionally causing tiny temblors. An anthropogenic source isn’t likely, she says, because of both the upward propagation direction, and the sequence depth of greater than 8 kilometers.
In the last two days of the swarm, the quakes jumped to a second plane and picked up speed, and then migrated to yet a third surface, with rates indicating that movement on these planes was occurring via aseismic creep. Any sort of “aseismic” movement by definition occurs without producing any seismicity or earthquake. But, occasionally, such slow movement gets stuck on an irregularity in the fault surface, called an asperity, says Hatch. When the asperity breaks, an earthquake occurs. “Those…produce earthquakes, [though] the majority of the slip [occurs] along the aseismic part,” she explains.
As the North American plate moves southward relative to the Pacific plate, the San Andreas Fault, which is also the plate boundary, focuses as much as 75% of this “right-lateral” motion. The remaining 25% of right-lateral motion occurs within the Walker Lane tectonic regime that runs along the California-Nevada border and ends near Death Valley. However, instead of concentrating this motion along a single fault, the Walker Lane region constitutes many smaller faults distributed across a swath of land.
Earthquake sequences and swarms in the Walker Lane often involve multiple fault segments and complicated fault geometries, and the Virginia City sequence is no exception, as Hatch and her coauthors show in their analysis. Such swarm-like activity, particularly on unknown faults, causes concern for state and local emergency managers because they know that small swarms can evolve over time, resulting in damaging ground motions. Thankfully, the Virginia City swarm quieted before harming the city and its people, allowing emergency managers to use the event as a practice run for more serious swarms.
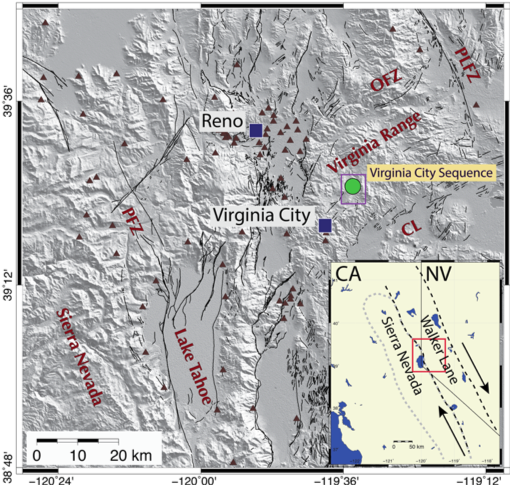
Figure 1. Inset shows map of California-Nevada border with outlines of both Walker Lane and the Sierra Nevada. The red box indicates the location of the main map, which focuses on the northern and western central Walker Lane region with black lines outlining various structures. Brown triangles are Nevada Seismological Laboratory permanent and temporary seismic stations. Blue boxes denote Reno and Virginia City. A green circle represents the Virginia City sequence. Credit: Hatch et al., 2020.
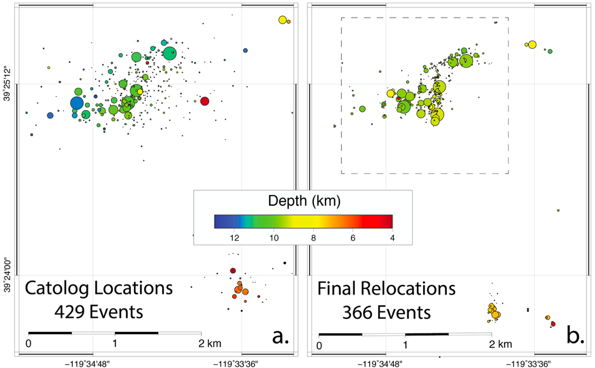
Figure 2. (a) Locations of earthquakes from the Nevada Seismological Laboratory catalog before Hatch et al.’s analysis. The size of the circle shows magnitude and the color shows the depth. (b) After relocation, the cloud of quakes resolves into three linear features, interpreted as fault planes. The quakes are again sized by magnitude and colored by depth. Grey dashed outline shows area and events that occurred during the 10 days of the swarm (305 events). Credit: Hatch et al., 2020.
Citation:
Hatch, R. L., Abercrombie, R. E., Ruhl, C. J., & Smith, K. D. (2020). Evidence of aseismic and fluid‐driven processes in a small complex seismic swarm near Virginia City, Nevada. Geophysical Research Letters, 47, e2019GL085477. https://doi.org/10.1029/2019GL085477
