
by Dr. Alka Tripathy-Lang and Dr. Wendy Bohon
The sun shines. Warmed air rises. Cool air rushes in to fill the space left behind. Everything shifts imperceptibly under this new atmospheric pressure, which is the pressure exerted by air on the world. Carefully leveled seismometers, tasked with monitoring earthquakes, explosions, and other earth-shaking phenomena, shelter from direct effects of these pressure changes via creative engineering. However, the ground itself can tilt ever so slightly, but just enough to thwart measurements of waves with a period greater than 10 seconds — long-period seismic data.
Seismic stations typically measure waves in three directions — up-down, north-south and east-west. The north-south and east-west sensors together comprise the horizontal component. For long-period seismic data, the vertical component reigns king. Because the horizontal component is more sensitive to tilting, such inclines caused by fluctuating atmospheric pressure can overwhelm the waves produced by large, distant earthquakes like normal modes and surface waves. Finding ways to rescue the signal from the noise would help scientists better calculate focal mechanisms of earthquakes, study the ocean’s tides, and illuminate the deep structures in our Earth.
One commonly applied solution requires simply ignoring all horizontal component information, and focusing exclusively on the more robust vertical data. However, scientists at the U.S. Geological Survey (USGS) Albuquerque Seismological Laboratory (ASL) are experimenting with ways of wringing out the noise to revive the horizontal component. In a recent study published in Geophysical Journal International, Alexis Alejandro, an undergraduate student at The University of New Mexico and USGS intern, and her colleagues at ASL found that each individual sensor responds uniquely to atmospheric pressure, and this response depends mostly on installation and local topography. They present site-specific calculations that can help researchers recover information from the horizontal components by removing the pressure signal using a mathematical processing technique.
To understand how seismic noise and atmospheric pressure change together, Alejandro and her colleagues focused their efforts on five different seismic stations around the U.S. that fall under the Global Seismographic Network (GSN). Each station hosts at least two seismometers and an instrument that carefully measures atmospheric pressure called a microbarograph.
 Factors that impact correlations between pressure and tilt-induced noise include installation and setting, so Alejandro and her colleagues looked for dissimilar stations. For example, many permanent seismic stations require seismic vaults to minimize temperature changes and other causes of tilt, like precipitation or wind. Vaults also reduce noise, and protect stations from hazards like flooding and vandalism. Sometimes, scientists opt to install seismic stations underground, either via a shallow post-hole or in a deep borehole, both of which reduce noise.
The five selected GSN locations include stations installed in caves, vaults, and a deep borehole. For most of the analysis, Alejandro focused on a 30 day span in 2018 with high quality data from all stations, from Oct. 7 to Nov. 6. All five stations displayed unique behaviors as atmospheric pressure changed, implying that a one-size-fits-all correction will not work. Instead, each station has its own distinctive response.
The Cathedral Cave, Missouri station lies 51 meters below Earth’s surface. At such depth, the cave’s floor might be insensitive to changes in atmospheric pressure. However, Alejandro and her colleagues discovered that this cave boasted the most sensitive correlation between tilt and atmospheric pressure changes, which they suggest results from peculiar effects that occur in enclosed spaces. Here, the wall of the cave induces pressure changes that cause the floor to tilt, explains Adam Ringler, a seismologist at Albuquerque Seismological Laboratory and coauthor of the paper. Such seemingly obscure details — the direction to which the chamber opens, or the wooden hut that houses the instruments leaning on a cave wall — all impact tilt.
Similar to Cathedral Cave, but even deeper underground, the Wyandotte Cave, Indiana, station nestles beneath 132 meters of Earth. Installed near a wall, three sides slope away from the station. When the pressure doesn’t change dramatically, each sensor experiences a different tilt, which may result from local cave geometry variations. With large pressure changes, all sensors tilt in the same direction. Alejandro and colleagues think the culprit may be the pressure front’s behavior or the cave’s response to large pressures, or both.
Back at the surface and in an arid desert, the station in Tucson, Arizona, contends with large daily temperature swings that muddy the interpretation of pressure. This station, installed in a vault on the side of a mountain, showcases different installation types and configurations, and these differences may explain why pressure changes appear to correlate with tilt direction in spite of the diurnal temperature signal.
On the other side of the U.S., in Harvard’s surface vault, two sensors huddle together on one side of an octagon-shaped pier, staring at a third sensor installed on the other side. All three show the same tilt direction. The most important influence on tilt likely stems from the geography around the site — a topographic ridge on which the station resides — as opposed to local effects.
Deep in the low-noise ANMO borehole in New Mexico, a sensor installed 188 meters deep shows the least correlation with pressure and no obvious tilt direction, as might be expected at such depths. Not even regional geographic structures seem to matter. However, a sensor installed 90 meters deep in the same borehole shows moderate correlation between pressure and tilt, which could result from the affect of atmospheric pressure changes on the nearby Manzano Mountains.
Alejandro and her colleagues also designed and constructed an experiment under station name TST, which they installed in the underground vault at Albuquerque Seismological Laboratory that stands only a few hundred meters from the borehole station, ANMO. By installing three seismic sensors within 0.2 meters (less than one foot) of one another, along with a microbarograph, they tested whether identically installed seismometers respond similarly in a controlled environment. Unexpectedly, the three sensors show substantial variability from one another, indicating that extremely local tilt effects dominate in areas that can’t hide the tilt signal behind other noise sources.
In short, any tilt-related signal could relate to large scale topography, vault geometry or installation details. Using the horizontal component data, Alejandro and her colleagues conclude, requires site-specific corrections. The IRIS Data Management Center hosts data for all stations used in this study, with GSN stations under network code IU, and TST stations under network code GS.
Citation: Alejandro, A. C. B., Ringler, A. T., Wilson, D. C., Anthony, R. E., & Moore, S. V. (2020). Towards understanding relationships between atmospheric pressure variations and long-period horizontal seismic data: a case study. Geophysical Journal International, 223(1), 676-691.
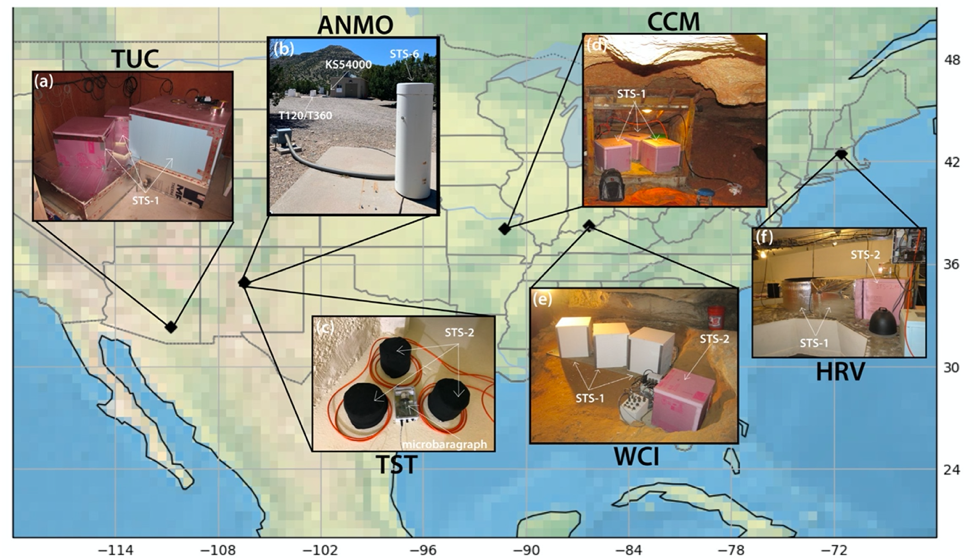
Figure 1. Map of the United States with locations of all seismic stations, including both global seismic network stations and experimental TST stations, used in this study (black diamonds). Extending from each black diamond is a picture that highlights what the seismic station looks like at each location. Each photo is labeled by its station name. TUC - Tucson, Arizona; ANMO - Albuquerque; TST - Albuquerque Seismological Laboratory Undergrad Vault, New Mexico; CCM - Cathedral Cave, Missouri; WCI - Wyandotte Cave, Indiana; and HRV - Adam Dziewonski Observatory (Oak Ridge), Harvard, Massachusetts. Credit: Alejandro et al., 2020.
Cover Image: Cathedral Cave Seismic Station, photo by the USGS
