
Unanticipated Benefits Realized from USArray Data
In the paper "Two-year survey comparing earthquake activity and injection-well locations in the Barnett Shale, Texas," published online on August 6 in the Proceedings of the National Academy of Sciences, Cliff Frohlich of the University of Texas at Austin uses data from Transportable Array stations and a Flexible Array deployment to measure the occurrence, time, location, and magnitude of small earthquakes near fluid injection wells in the vicinity Dallas-Fort Worth and Cleburne, Texas. As is clear from Seismological Grand Challenges in Understanding Earth's Dynamic Systems and other Earth science plans, seismic data have uses in a wide range of research and societal applications. Indeed, Frohlich notes in his paper that "EarthScope was conceived and funded prior to most of the recent development of unconventional gas resources, and before the public realization that this development might trigger seismic activity."
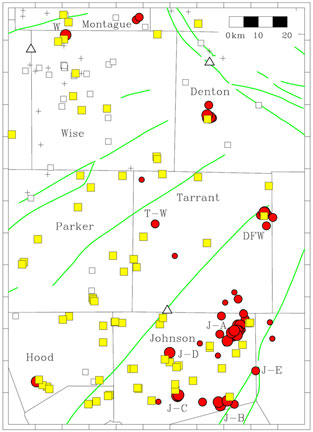 |
Map shows earthquake epicenters determined in the study (red circles), injection wells (squares and + symbols) in use since October 2006, seismograph stations (white triangles), and mapped faults (green lines). Circle sizes indication quality of epicentral location with large, medium and small sizes indicating qualities A, B, and C. For injection wells, yellow squares are wells with maximum monthly injection rates exceeding 150,000 barrels of water per month (BWPM); white squares, exceeding 15,000 BWPM; + symbols, exceeding 1,500 BWPM. (Courtesy of Cliff Frohlich, University of Texas at Austin). |
